- English (UK)
- English (India)
- English (Canada)
- English (Australia)
- English (South Africa)
- English (Philippines)
- English (Nigeria)
- Deutsch
- Español (España)
- Español (México)
- Français
- Italiano
- Nederlands
- Polski
- Português (Portugal)
- Português (Brasil)
- Русский
- Türkçe
- العربية
- Ελληνικά
- Svenska
- Suomi
- עברית
- 日本語
- 한국어
- 简体中文
- 繁體中文
- Bahasa Indonesia
- Bahasa Melayu
- ไทย
- Tiếng Việt
- हिंदी

Crown Castle International Corp (CCI)
Crown Castle International Corp stock price live, this page displays NYSE CCI stock exchange data. View the CCI premarket stock price ahead of the market session or assess the after hours quote. Monitor the latest movements within the Crown Castle International Corp real time stock price chart below.
What Is the Crown Castle International Corp Stock Price Today?
The Crown Castle International Corp stock price today is 85.63.
What Is the Stock Symbol for Crown Castle International Corp?
The stock ticker symbol for Crown Castle International Corp is CCI.
Is CCI the Same as $CCI?
$CCI is a common way to refer to the Crown Castle International Corp ticker symbol in social media, forums, and online discussions. The dollar sign is a shorthand convention used to indicate that it is a stock ticker symbol
What Stock Exchange Does Crown Castle International Corp Trade On?
Crown Castle International Corp is listed and trades on the NYSE stock exchange.
Is Crown Castle International Corp a Good Stock to Buy?
Determining whether Crown Castle International Corp—or any stock—is a good buy requires comprehensive analysis. To evaluate its potential, users can sign up to InvestingPro, where they can assess the current Crown Castle International Corp share price compared with the fair value and other essential metrics.
You can find more details by visiting the additional pages to view historical data, charts, latest news, analysis or visit the forum to view opinions on the CCI quote. (ISIN: US22822V1017)
Fair Value
An estimate of a stock's true price based on valuation models like discounted cash flow, peer valuation multiples, and dividend discount models.
Day's Range
85.45
87.05
52 wk Range
75.96
115.76
Earnings results expected in 6 days
1/3
Fair Value
An estimate of a stock's true price based on valuation models like discounted cash flow, peer valuation multiples, and dividend discount models.
Day's Range
85.4587.05
52 wk Range
75.96115.76
Key Statistics
Edit
Prev. Close
Open
Volume
Average Vol. (3m)
1-Year Change
Book Value / Share
Fair Value
Fair Value Upside
Market Cap
Shares Outstanding
Revenue
Net Income
EPS
EPS Growth Forecast
Next Earnings Date
(4.88%)
Dividends Payment Streak
P/E Ratio
Return on Assets
Return on Equity
Gross Profit Margin
Price/Book
EBITDA
EV/EBITDA
Beta
CCI Scorecard
Company’s Health
Assesses a company's financial position by analyzing its market value, financial ratios, industry benchmarks, and competitors.
UnlockFair Value
An estimate of a stock's true price based on valuation models like discounted cash flow, peer valuation multiples, and dividend discount models.
Unlock PriceTechnical Analysis
Neutral
Price Target
97.47
Upside
+13.83%
Members' Sentiments
Bearish
Bullish
ProTips
Tips that distill complex financial data into concise, actionable investment insights.
Trading at a high earnings multiple
- Crown Castle Int receives Investment Bank Analyst Rating Update
- Investing.com
Pro
- Crown Castle Int receives Investment Bank Analyst Rating Update
- Investing.com
Pro - Crown Castle stock hits 52-week low at $77.01
- Investing.com
Technical Analysis
Summary
Strong Sell
Sell
Neutral
Buy
Strong Buy
Strong Sell
Technical Indicators
Strong Sell
Moving Averages
Sell
Crown Castle Inc. owns, operates and leases approximately 40,000 cell towers and approximately 90,000 route miles of fiber supporting small cells and fiber solutions across every major U.S. market. This nationwide portfolio of communications infrastructure connects cities and communities to essential data, technology and wireless service – bringing information, ideas and innovations to the people and businesses that need them. Crown Castle Inc. was incorporated in 1994 in Delaware, USA.
Crown Castle International Corp SWOT Analysis
Market Valuation | Analyst price targets range from $112 to $125, averaging $119, reflecting confidence in CCI's tower-focused strategy despite execution risks during this transitional period. |
Dividend Dynamics | Explore how CCI's 30% dividend reduction to $4.25 is balanced by a substantial $6.0B share repurchase program, reshaping its capital allocation strategy for long-term growth. |
Financial Trajectory | Analysts project AFFO growth to $4.23 in 2025 and $5.07 in 2026, with tower organic revenue rebounding from -0.4% to +4.1% as Sprint churn decreases. |
Tower Transformation | Crown Castle's strategic pivot to become a pure-play U.S. tower company through an $8.5B divestiture of fiber and small cell operations marks a fundamental business realignment. |
Crown Castle International Corp Earnings Call Summary for Q4/2025
- Crown Castle reported Q4 2025 EPS of $0.67, exceeding forecasts by 21.82%, with revenue of $1.06 billion meeting projections and stock rising 0.23% after hours.
- The company is implementing major restructuring, including a 20% workforce reduction and plans to sell its small cell and fiber businesses in early 2026.
- Financial guidance for 2026 projects $3.9 billion in site rental revenues, $2.7 billion in adjusted EBITDA, and $1.9 billion in AFFO with 3.5% organic growth rate.
- Management announced $1 billion for share repurchases and $7 billion for debt repayment while maintaining the annual dividend at $4.25 per share.
- Despite terminating a contract with DISH Wireless, CEO Chris Hillebrand emphasized that 80% of 2026 organic growth is already contracted, with improved growth expected in 2027.
Last Updated: 02/04/2026, 05:45 PM
Read Full TranscriptCrown Castle investor slides for Q4/2025
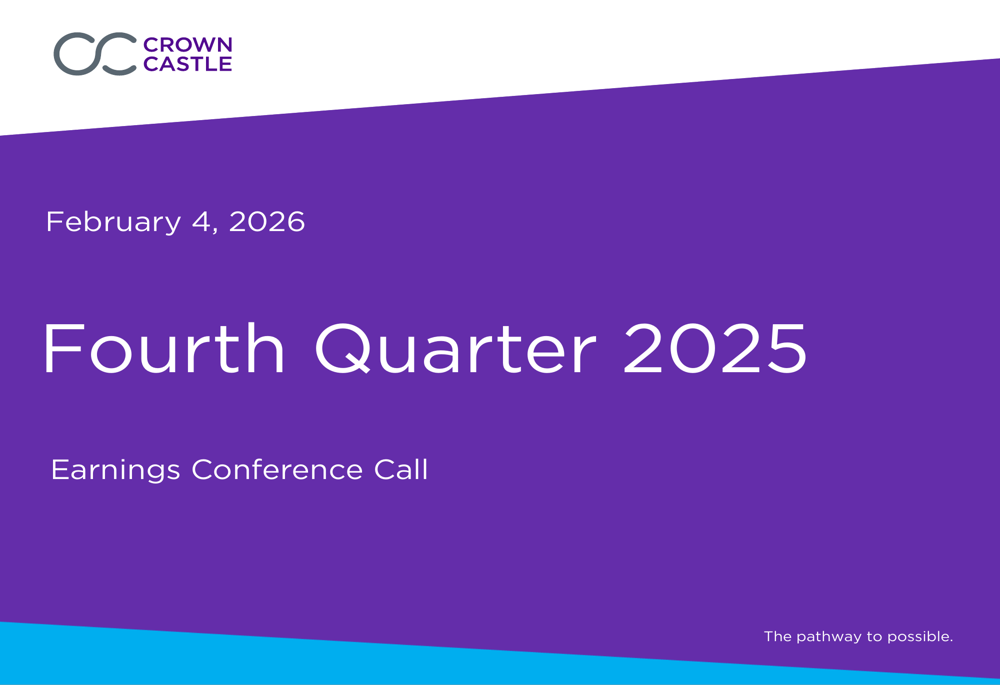
Last Update: Feb 04, 2026
See full investor slides
Compare CCI to Peers and Sector
Metrics to compare | CCI | Sector Sector - Average of metrics from a broad group of related Real Estate sector companies | Relationship RelationshipCCIPeersSector | |
|---|---|---|---|---|
P/E Ratio | 33.9x | 9.6x | 9.1x | |
PEG Ratio | 0.30 | 1.30 | 0.01 | |
Price / Book | −22.9x | 0.7x | 0.9x | |
Price / LTM Sales | 8.8x | 2.9x | 3.9x | |
Upside (Analyst Target) | 10.4% | 24.9% | 15.9% | |
Fair Value Upside | Unlock | 1.0% | 0.1% | Unlock |
Analyst Ratings
11 Buy
10 Hold
0 Sell
Ratings:
21 analysts
Overall Consensus
Buy
Analysts 12-Month Price Target:
Average 97.47
(+13.83% Upside)
Earnings
Latest Release
Feb 04, 2026
EPS / Forecast
0.67 / 0.55
Revenue / Forecast
1.07B / 1.06B
People Also Watch
FAQ
What Is the Crown Castle (CCI) Stock Price Today?
The Crown Castle stock price today is 85.63 USD.
What Stock Exchange Does Crown Castle Trade On?
Crown Castle is listed and trades on the New York Stock Exchange.
What Is the Stock Symbol for Crown Castle?
The stock symbol for Crown Castle is "CCI."
Does Crown Castle Pay Dividends? What’s The Current Dividend Yield?
The Crown Castle dividend yield is 4.88%.
What Is the Crown Castle Market Cap?
As of today, Crown Castle market cap is 37.35B USD.
What Is Crown Castle's Earnings Per Share (TTM)?
The Crown Castle EPS (TTM) is 2.52.
When Is the Next Crown Castle Earnings Date?
Crown Castle will release its next earnings report on Apr 22, 2026.
From a Technical Analysis Perspective, Is CCI a Buy or Sell?
Based on moving averages and other technical indicators, the daily buy/sell signal is Neutral.
How Many Times Has Crown Castle Stock Split?
Crown Castle has split 0 times.
How Many Employees Does Crown Castle Have?
Crown Castle has 1500 employees.
What is the current trading status of Crown Castle (CCI)?
As of Apr 16, 2026, Crown Castle (CCI) is trading at a price of 85.63 USD, with a previous close of 86.27 USD. The stock has fluctuated within a day range of 85.45 USD to 87.05 USD, while its 52-week range spans from 75.96 USD to 115.76 USD.
What Is Crown Castle (CCI) Price Target According to Analysts?
The average 12-month price target for Crown Castle is 97.47 USD, with a high estimate of 125 USD and a low estimate of 85 USD. 11 analysts recommend buying the stock, while 0 suggest selling, leading to an overall rating of Buy. The stock has an +13.83% Upside potential.
What Is the CCI Premarket Price?
CCI's last pre-market stock price is 85.53 USD. The pre-market share volume is 470.00, and the stock has decreased by -0.74, or -0.86%.
What Is the CCI After Hours Price?
CCI's last after hours stock price is 85.90 USD, the stock has decreased by 0.27, or 0.32%.
Install Our App
Risk Disclosure: Trading in financial instruments and/or cryptocurrencies involves high risks including the risk of losing some, or all, of your investment amount, and may not be suitable for all investors. Prices of cryptocurrencies are extremely volatile and may be affected by external factors such as financial, regulatory or political events. Trading on margin increases the financial risks.
Before deciding to trade in financial instrument or cryptocurrencies you should be fully informed of the risks and costs associated with trading the financial markets, carefully consider your investment objectives, level of experience, and risk appetite, and seek professional advice where needed.
Fusion Media would like to remind you that the data contained in this website is not necessarily real-time nor accurate. The data and prices on the website are not necessarily provided by any market or exchange, but may be provided by market makers, and so prices may not be accurate and may differ from the actual price at any given market, meaning prices are indicative and not appropriate for trading purposes. Fusion Media and any provider of the data contained in this website will not accept liability for any loss or damage as a result of your trading, or your reliance on the information contained within this website.
It is prohibited to use, store, reproduce, display, modify, transmit or distribute the data contained in this website without the explicit prior written permission of Fusion Media and/or the data provider. All intellectual property rights are reserved by the providers and/or the exchange providing the data contained in this website.
Fusion Media may be compensated by the advertisers that appear on the website, based on your interaction with the advertisements or advertisers.
© 2007-2026 - Fusion Media Limited. All Rights Reserved.